The following information is provided in accordance with Texas State Statute 2256.0016.
As of June 30, 2022
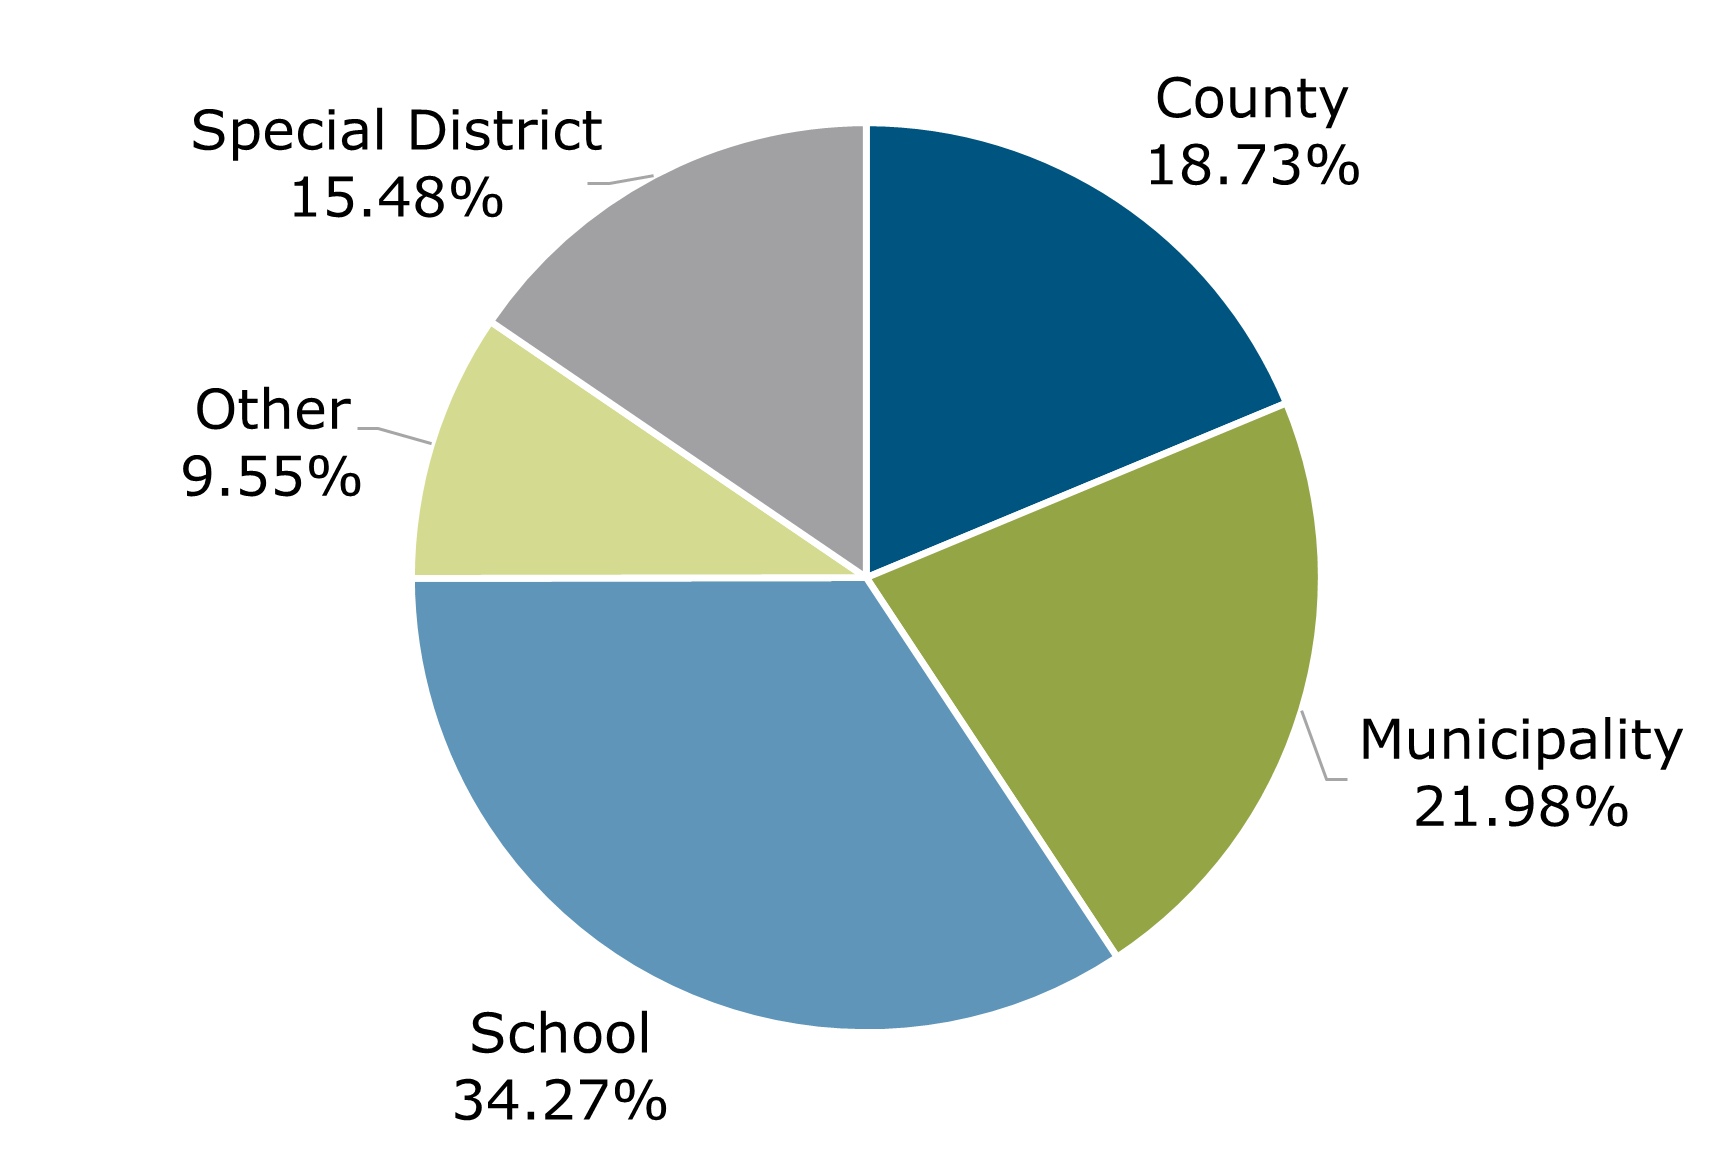
Participant Breakdown by Balance
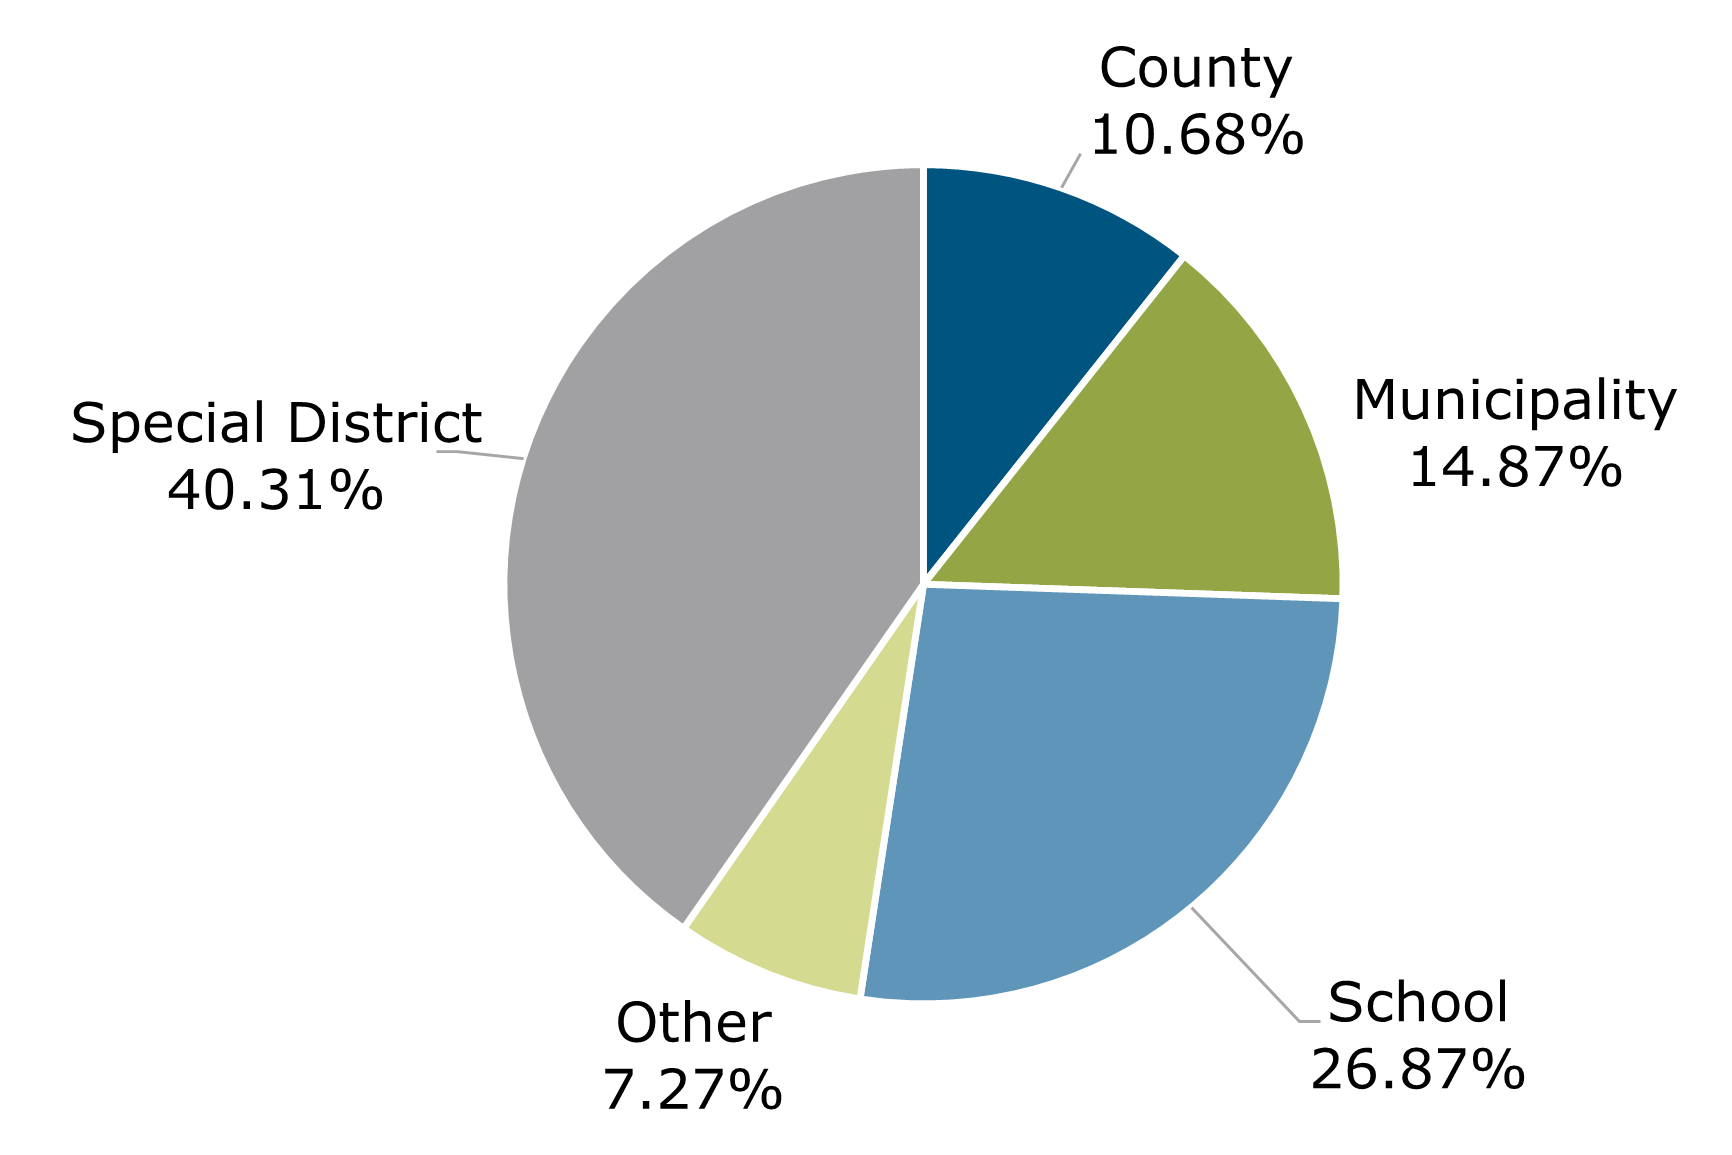
Participant Breakdown by Entity Type
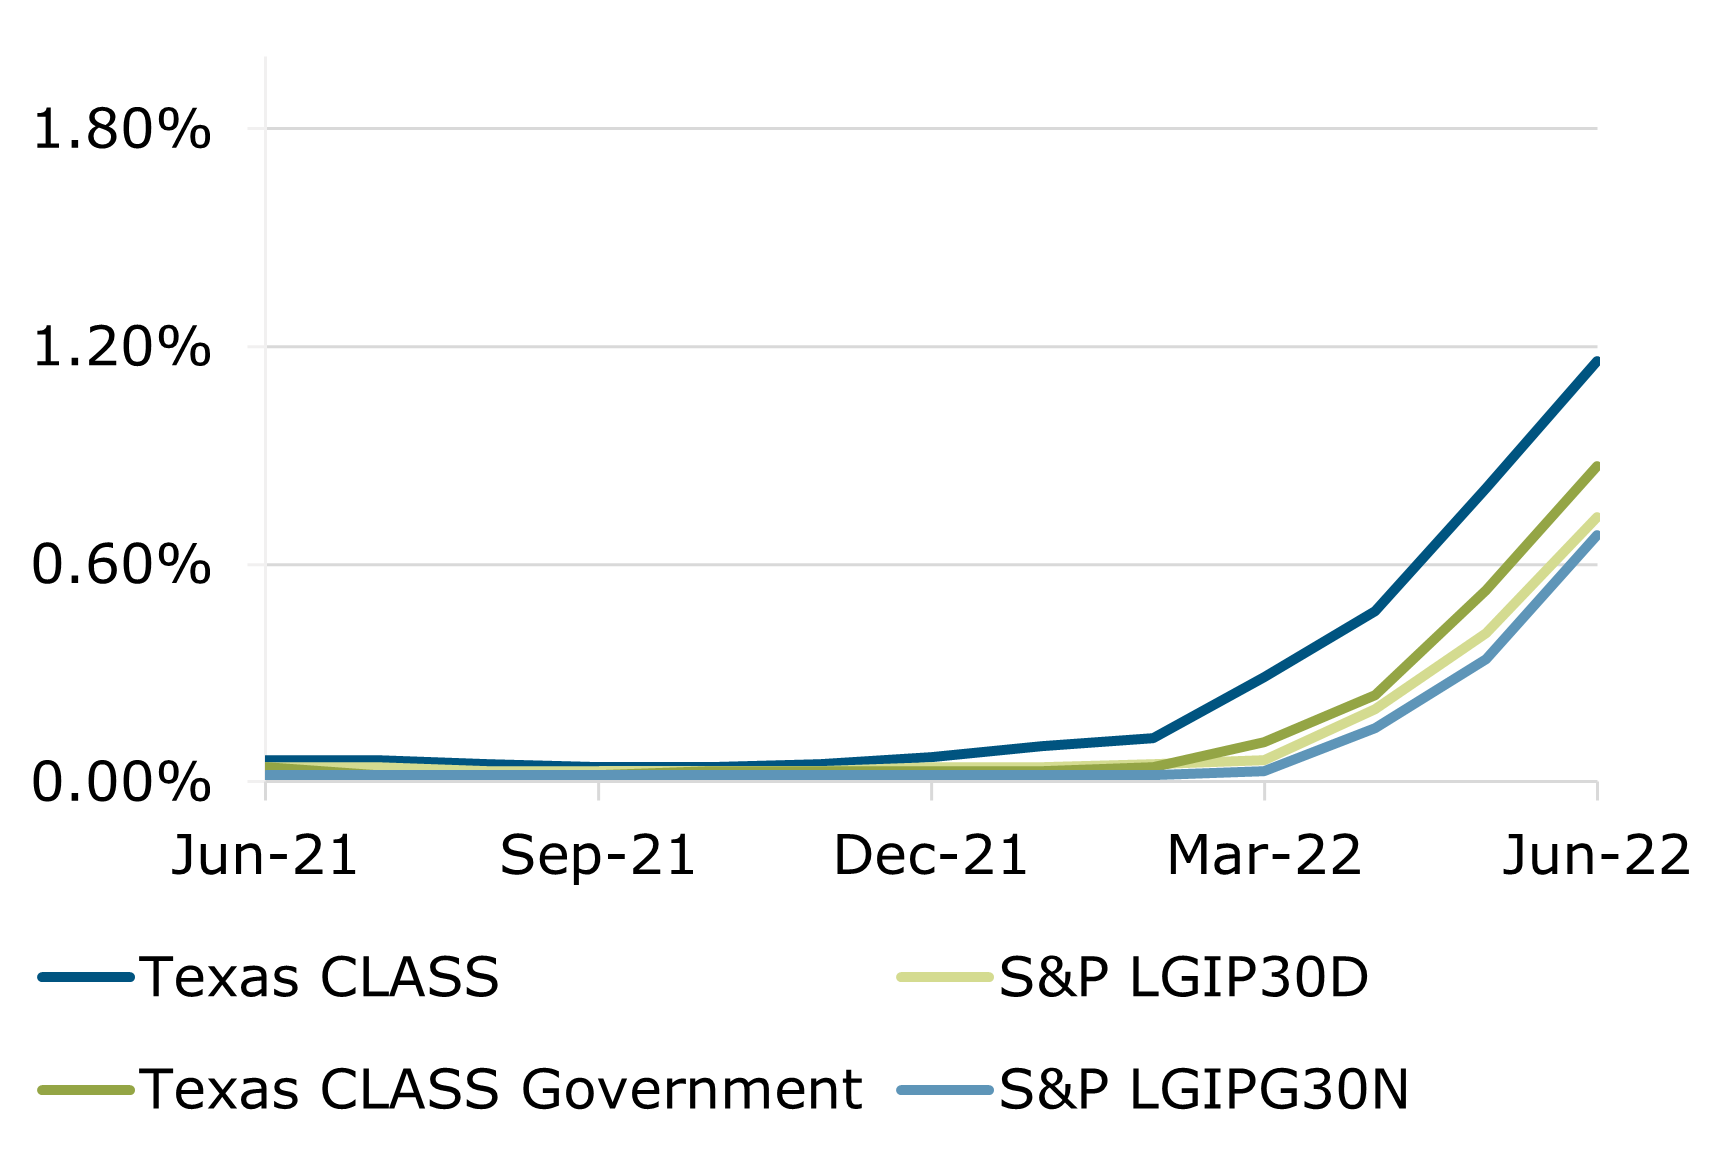
Performance vs. Benchmark S&P AAA/AA GIP* (Average Monthly Yields)
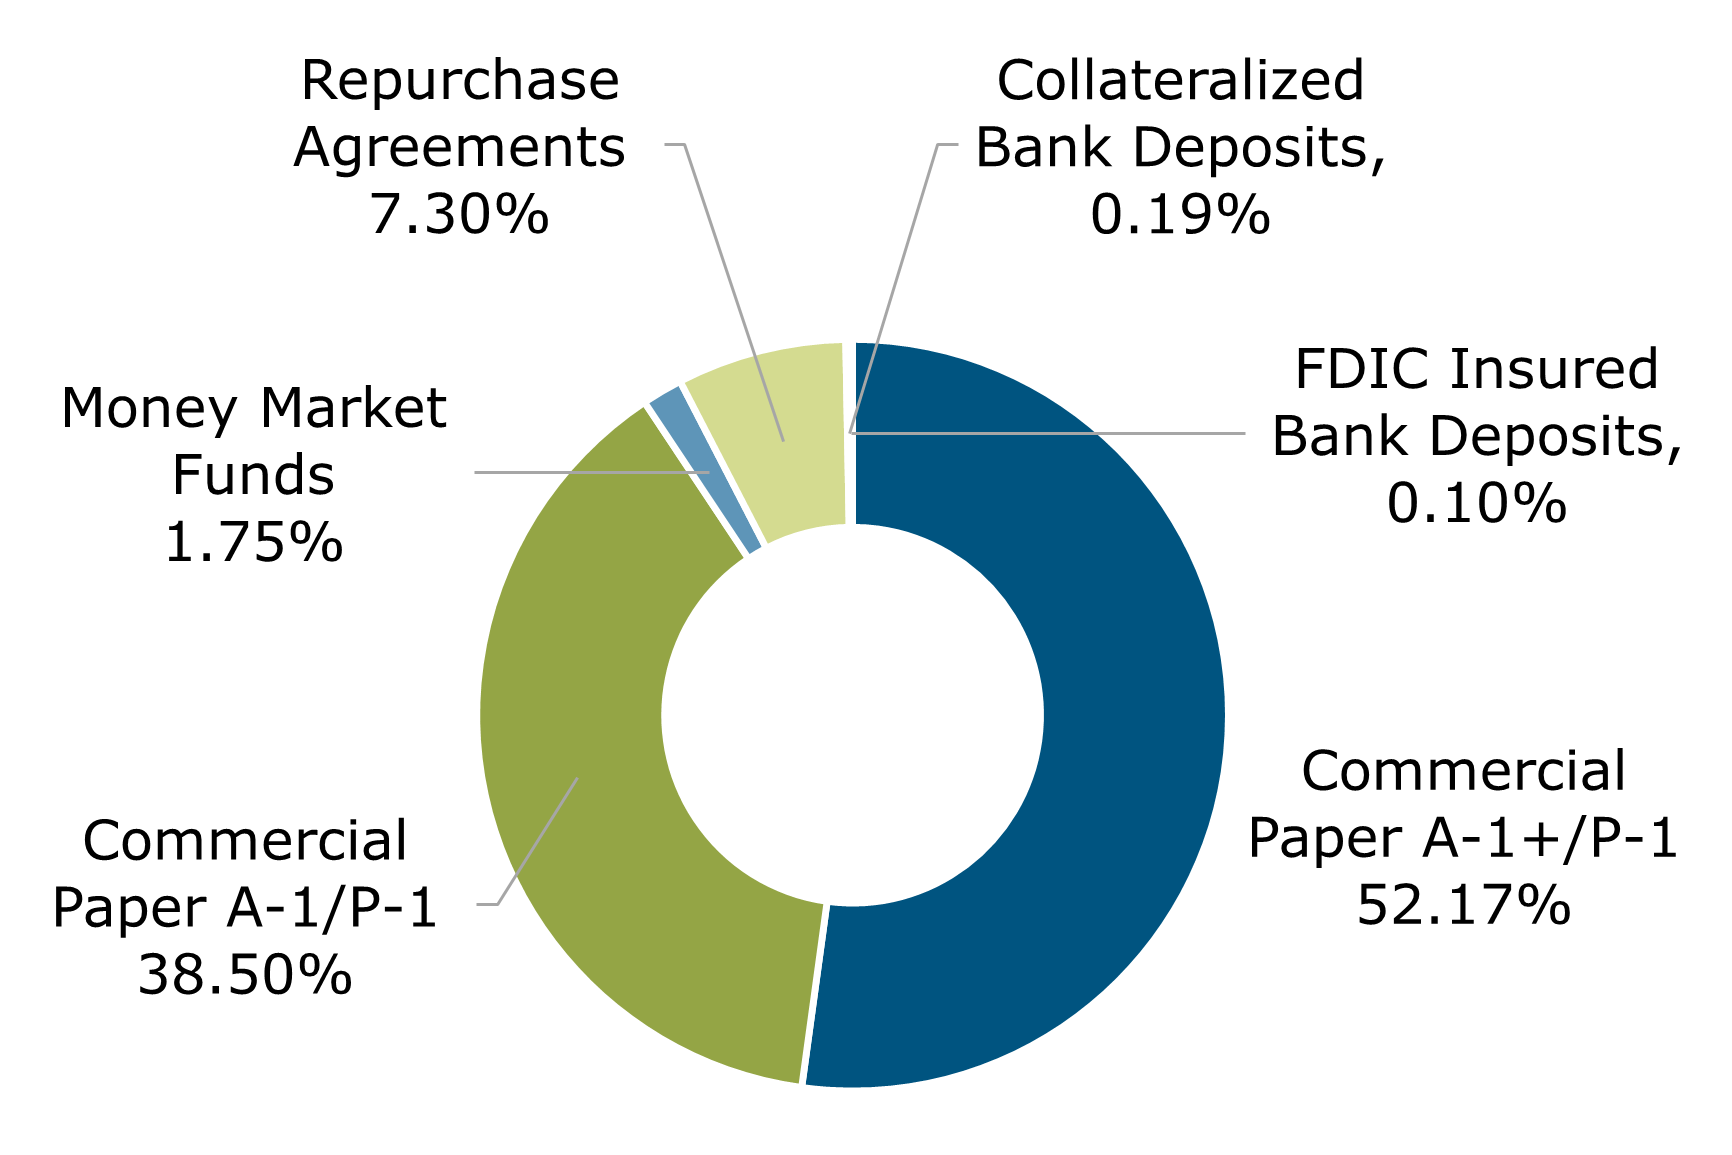
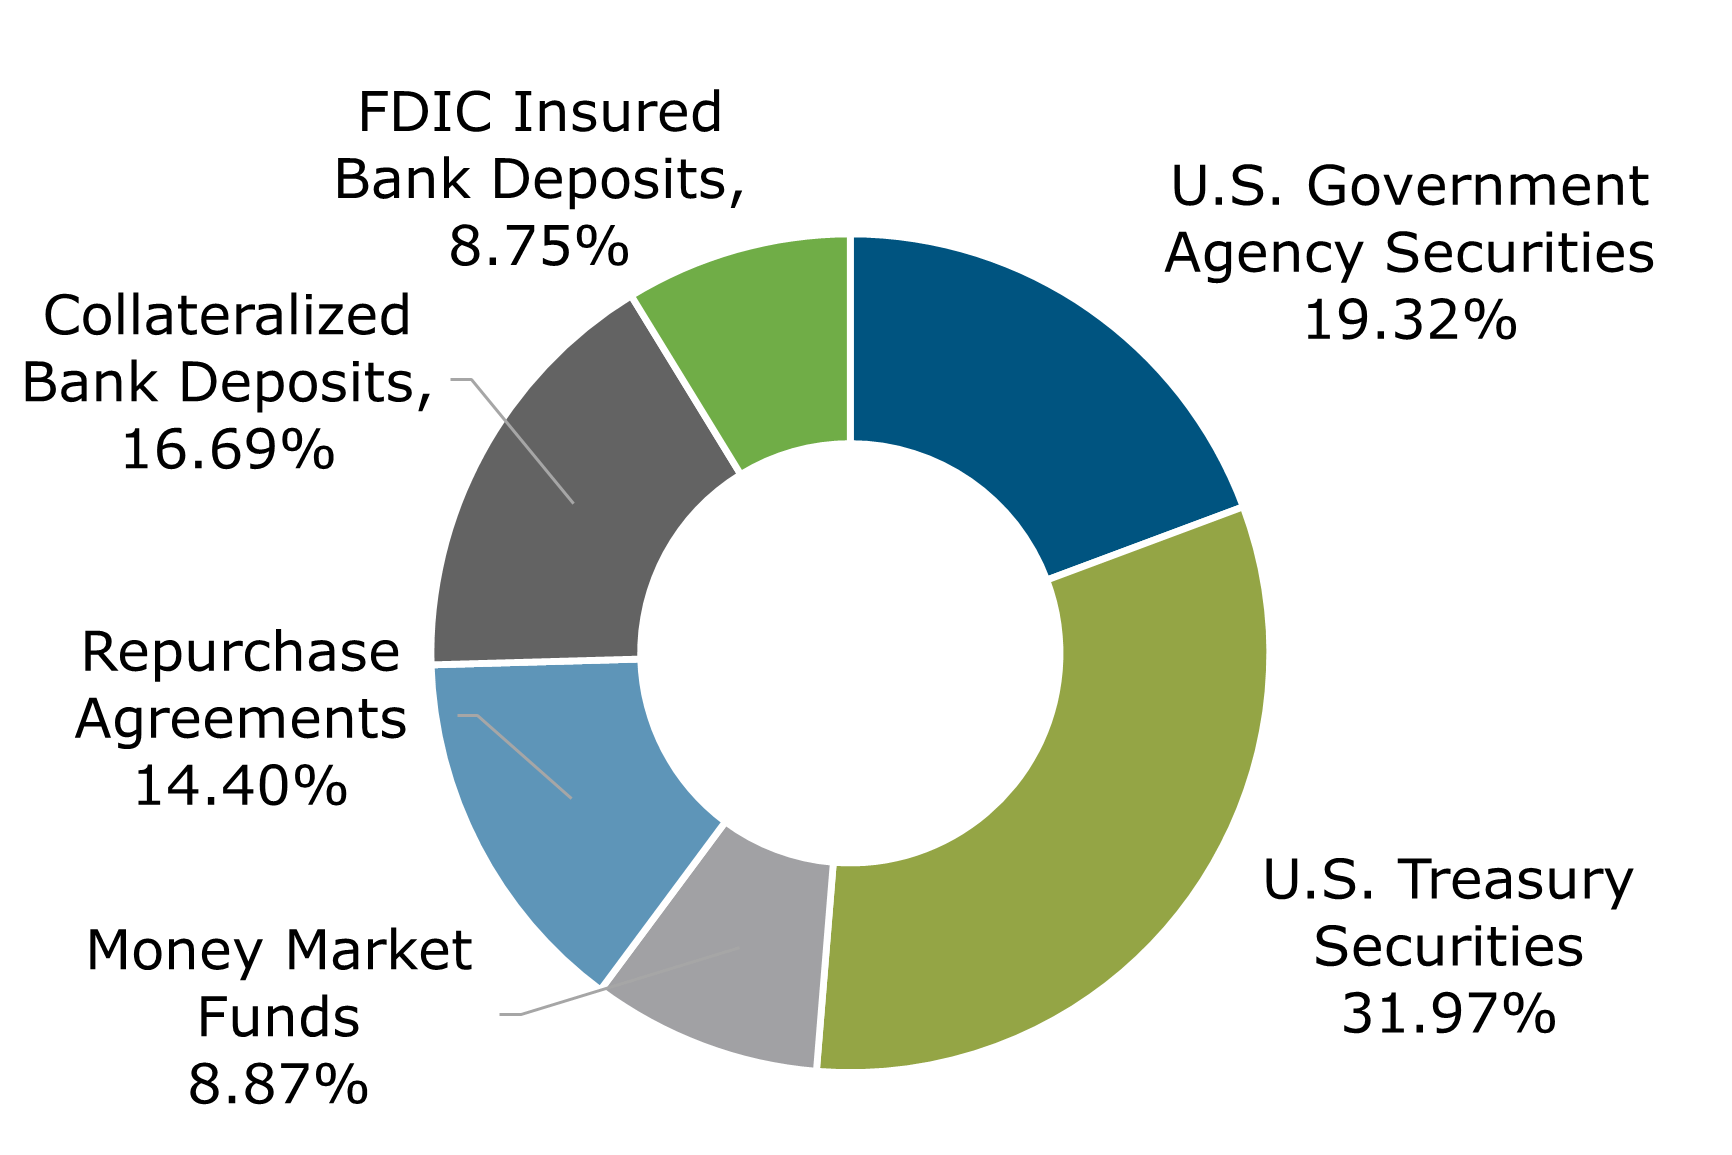
Texas CLASS Portfolio Breakdown
Texas CLASS Government Portfolio Breakdown
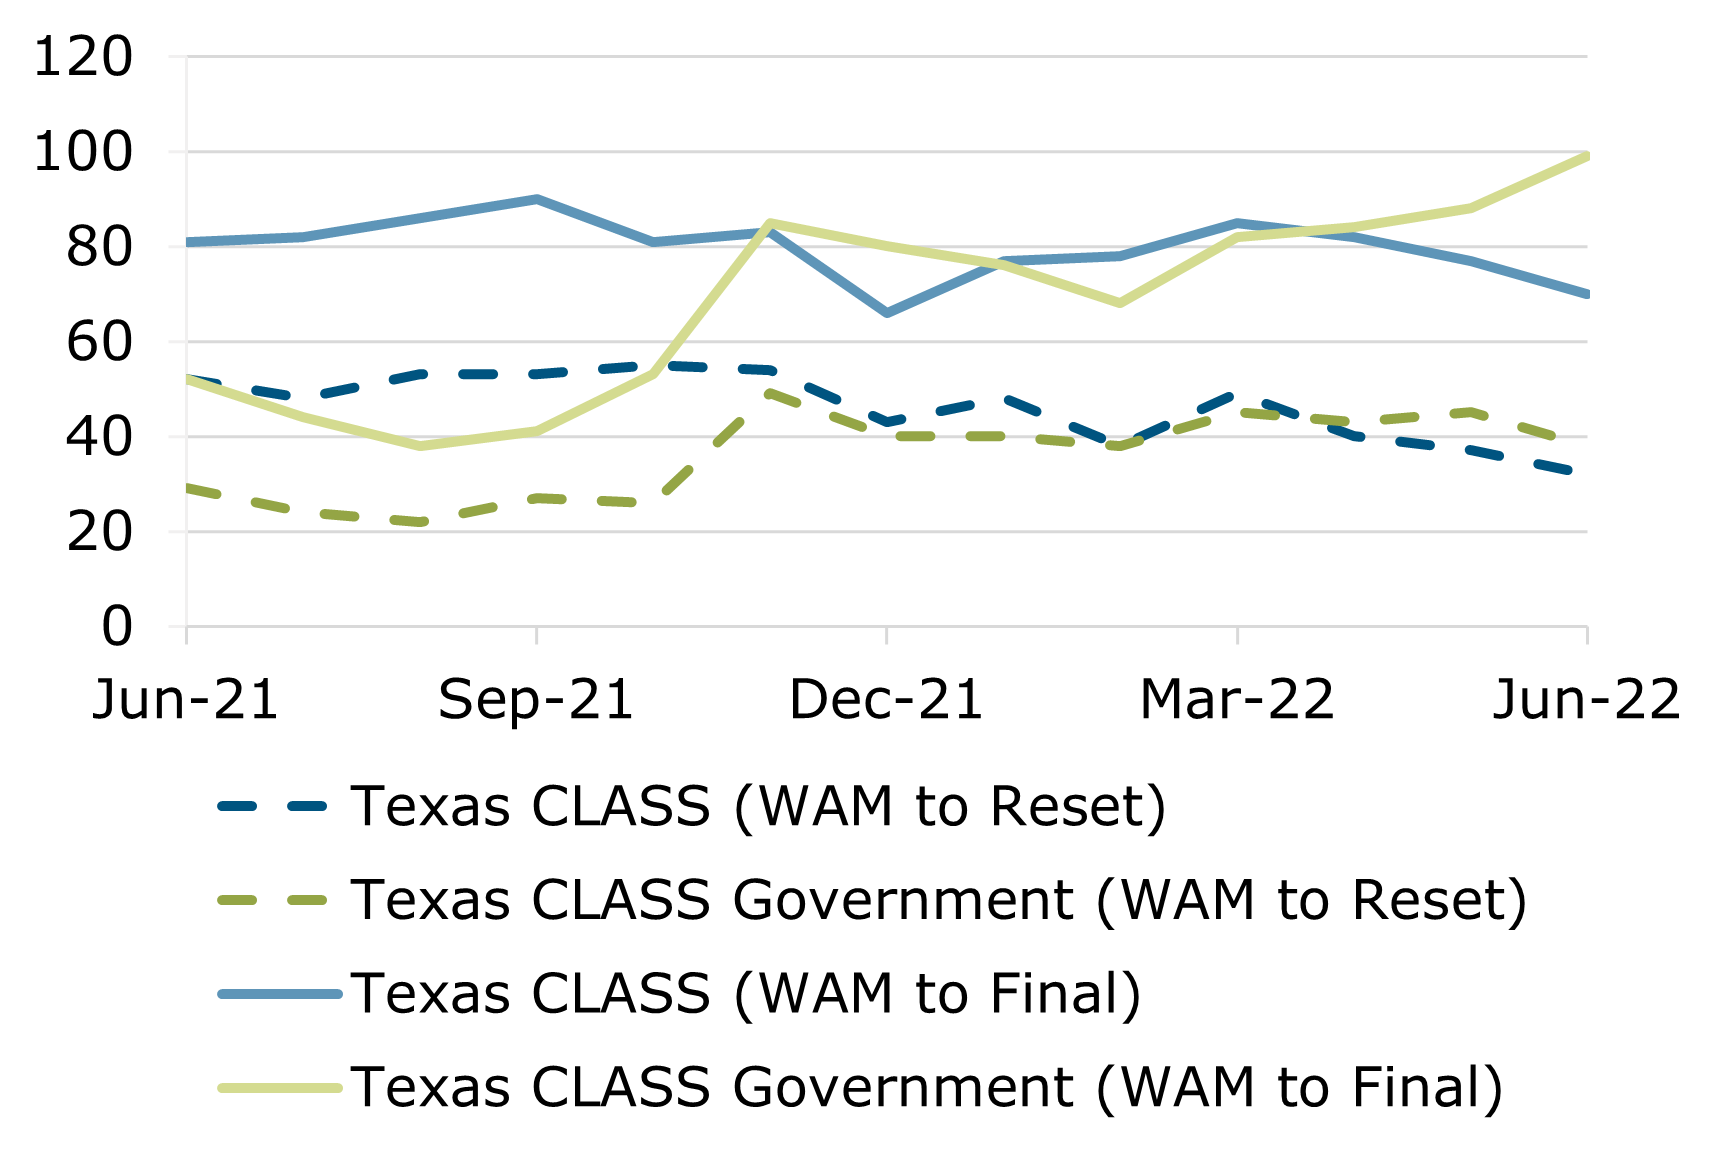
Weighted Average Maturity (In Days)
Texas CLASS Prior Month Comparison
Month
End
Average
Yield**
Month Ending Assets
Share
Balance
Market
Value
Amortized
Cost
NAV
WAM
(Reset)***
WAM (Final)***
Apr-22
0.47%
$16,058,128,318
16,065,181,157
$16,063,797,884
$16,071,013,322
1.00
40
82
May-22
0.81%
$15,514,359,401
15,519,346,229
$15,684,049,927
$15,689,036,755
1.00
37
77
Jun-22
1.16%
$15,814,190,462
15,823,796,455
$15,800,678,703
$15,810,284,696
1.00
32
70
**Average monthly yield ***As of the end of the last day of the month
Texas CLASS Government Prior Month Comparison
Month
End
Average
Yield**
Month Ending
Assets
Share
Balance
Market
Value
Amortized
Cost
NAV
WAM
(Reset)***
WAM (Final)***
Apr-22
0.24%
$1,573,622,586
1,574,706,788
$1,580,552,462
$1,581,643,835
1.00
43
84
May-22
0.53%
$1,628,346,078
1,629,263,934
$1,634,122,517
$1,635,040,373
1.00
45
88
Jun-22
0.87%
$1,494,813,364
1,496,419,591
$1,494,922,355
$1,496,528,583
1.00
38
99
**Average monthly yield ***As of the end of the last day of the month
2021-2022 Texas CLASS Average Monthly Yields
Texas CLASS
Texas CLASS Government
July
2021
0.0615%
|
July
2021
0.0199%
August
2021
0.0506%
|
August
2021
0.0156%
September
2021
0.0442%
|
September
2021
0.0211%
October
2021
0.0435%
|
October
2021
0.0283%
November
2021
0.0539%
|
November
2021
0.0251%
December
2021
0.0692%
|
December
2021
0.0260%
January
2022
0.0965%
|
January
2022
0.0332%
February
2022
0.1229%
|
February
2022
0.0383%
March
2022
0.2857%
|
March
2022
0.1118%
April
2022
0.4720%
|
April
2022
0.2409%
May
2022
0.8130%
|
May
2022
0.5260%
June
2022
1.1577%
|
June
2022
0.8659%
Fund Highlights as of June 30, 2022 (Unaudited)
For the month of June 2022, the Program Administrator accrued fees of $1,242,742.71 and had average shares outstanding of 16,133,123,971.14 for Texas CLASS. For Texas CLASS Government, the Program Administrator accrued fees of $156,110.07 and had average shares outstanding of 1,635,753,078.55. The fees for both Texas CLASS and Texas CLASS Government are accrued on a daily basis. The applicable fee rate is calculated by taking the fee rate(s) divided by 365 days (366 days in the event of a leap year) and rounded to ten decimal places. The current day’s settled shares outstanding will be multiplied by the applicable fee rate(s) to equal the daily fee accrual. For weekend days and holidays, the settled shares outstanding for the previous business day will be utilized for the calculation of the fees. The applicable fee rate is located in Exhibit F of the Ninth Amended and Restated Trust Agreement. The Program Administrator reserves the right to abate fees listed in the Ninth Amended and Restated Trust Agreement. The monthly fee is the sum of all daily fee accruals for the month of June. The fees are paid monthly upon notification to the custodian bank. As of June 30, 2022 the fee for Texas CLASS was 9 basis points and the fee for Texas CLASS Government was 12 basis points.
Both funds are rated ‘AAAm’ by S&P Global Ratings.
Net Asset Value for both funds from June 1 to June 30, 2022 is equal to $1.00.
The final maturity dates of all securities were less than one year.
The custodian bank for Texas CLASS is UMB Bank.
Total number of Participants is 908.
There are currently no investments that have a stated maturity greater than one year.
The portfolio managers for Texas CLASS is Neil Waud, CFA and Randy Palomba, CFA.
All sources of payment are the underlying assets of the local government investment pool at market value.
The Ninth Amended and Restated Trust Agreement was adopted by the Board of Trustees on February 25, 2021. You can access your copy of the Ninth Amended and Restated Trust Agreement by visiting our website at www.texasclass.com.
To view the current members of the Texas CLASS Board of Trustees and Advisory Board, please click here.
Data unaudited. Charts may not equal 100% due to rounding. Performance results for both Texas CLASS and Texas CLASS Government are shown net of all fees and expenses and reflect the reinvestment of dividends and other earnings. Many factors affect performance including changes in market conditions and interest rates and in response to other economic, political, or financial developments. Investment involves risk including the possible loss of principal. No assurance can be given that the performance objectives of a given strategy will be achieved. All comments and discussion presented are purely based on opinion and assumptions, not fact. These assumptions may or may not be correct based on foreseen and unforeseen events. The information presented should not be used in making any investment decisions. This material is not a recommendation to buy, sell, implement, or change any securities or investment strategy, function, or process. Any financial and/or investment decision should be made only after considerable research, consideration, and involvement with an experienced professional engaged for the specific purpose. Past performance is not an indication of future performance. Any financial and/or investment decision may incur losses. A ‘AAAm’ rating by S&P Global Ratings is obtained after S&P evaluates a number of factors including credit quality, market price exposure, and management. Ratings are subject to change and do not remove credit risk. Click here for more information.
*The benchmark, the S&P US AAA & AA Rated GIP All 30 Day Net Yield (LGIP30D) is a performance indicator of rated GIPs that maintain a stable net asset value of $1.00 per share and is an unmanaged market index representative of the LGIP universe. The S&P benchmark utilized in this comparison is a composite of all rated stable net asset value pools. GIPs in the index include only those rated based on S&P’s money market criteria. Pools rated ‘AAAm’ provide excellent safety and a superior capacity to maintain principal value while those rated ‘AAm’ offer very good safety and a strong capacity to maintain principal value (Source: S&P Global Ratings’ website). The comparison between this index and the portfolio may differ in holdings, duration, fees, and percentage composition of each holding. Such differences may account for variances in yield.
*The benchmark, the S&P AAA & AA Rated GIP Govt 30 Day Net Yield (LGIPG30N) is a performance indicator of rated GIPs that maintain a stable net asset value of $1.00 per share and is an unmanaged market index representative of the LGIP universe. The S&P benchmark utilized in this comparison is comprised of pools that invest in U.S. Government securities, U.S. Treasury securities, Repurchase agreements collateralized by U.S. government and treasury securities or any combination of the above. GIPs in the index include only those rated based on S&P’s money market criteria. Pools rated ‘AAAm’ provide excellent safety and a superior capacity to maintain principal value while those rated ‘AAm’ offer very good safety and a strong capacity to maintain principal value (Source: S&P Global Ratings’ website). The comparison between this index and the portfolio may differ in holdings, duration, fees, and percentage composition of each holding. Such differences may account for variances in yield.
Calculation methodology for the LGIP30D and LGIPG30N is the monthly average of the each week’s seven day average rate as provided by Bloomberg.